 Signin


Table
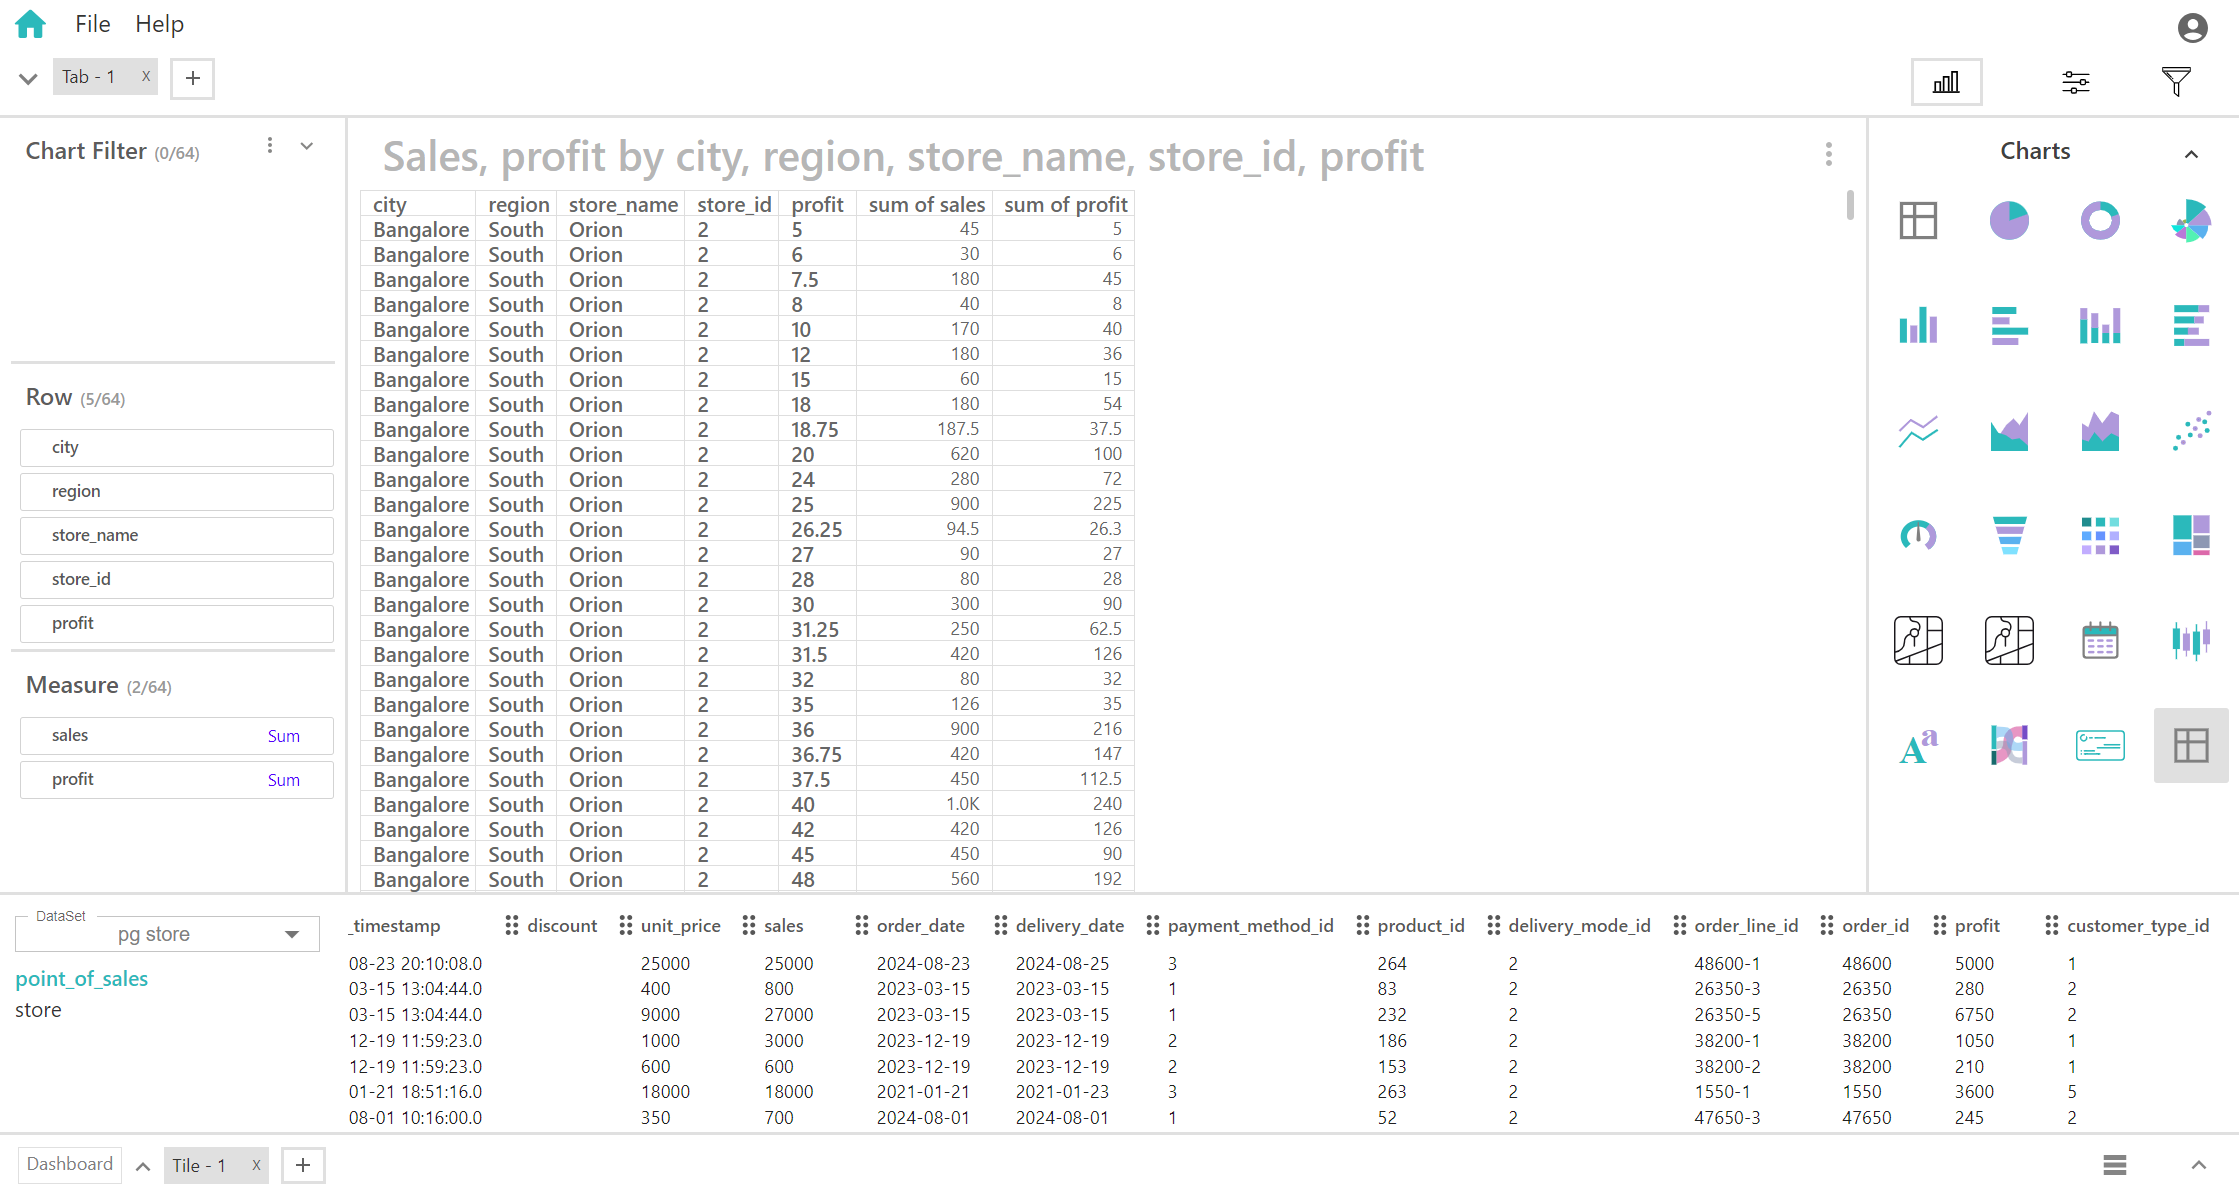
A table is a structured way to display data in rows and columns, allowing for organized and easily readable presentation of information. Tables are widely used in various contexts such as data analysis, reporting, and user interfaces.
When working with a table where the key fields are row and measure, the table is primarily focused on displaying numerical metrics (measures) organized by different categories or entities (rows).
Key Fields of a Table: Row and Measure
- Represents the categories or entities that define each row in the table. Provides the basis for organizing the data, where each row corresponds to a specific category or item. Each row typically contains data related to a single record or observation, such as a specific product, individual, or time period.
- Different products, time periods, or locations.
- Represents the quantitative value being analyzed, displayed within the cells of the table. Each cell in the table contains the measure value for a specific combination of row and column. Provides detailed numerical information related to the attributes defined by the rows and columns.
- Sum of Sales, Average of Profit, Order date, Delivery Date.
You can display a maximum of 64 Rows and 64 Measures in your chart/table.
Potential Uses of Table:
- Ideal for displaying extensive datasets with multiple dimensions and attributes. Each cell represents a data point within the broader context of rows and columns.
- Allows for detailed comparison across multiple attributes and records, making it suitable for analyzing complex relationships and trends.
- Useful for generating comprehensive reports where detailed data is required, such as financial statements, performance metrics, or detailed surveys.