 Signin
Silzila is a data exploration and dashboarding tool. You can connect to data, explore data and present data within a company or to the entire world.
Silzila is available as open source desktop installation for personal use or as an on-cloud versions as community version as well as enterprise offerings. Please check the product section to choose your preferred product and installation or sign-up details.
Here are the topics covered in documentation section:
In this section, instructions are given on prerequsites and how to install open source version of Silzila in Desktop and how to start the application.
Databases are the most elegant and common source of data for connecting to Silzila and exploring data. In this section, supported databases are listed and each database is covered in detail on how to test, connect and save it to reuse the DB connection.

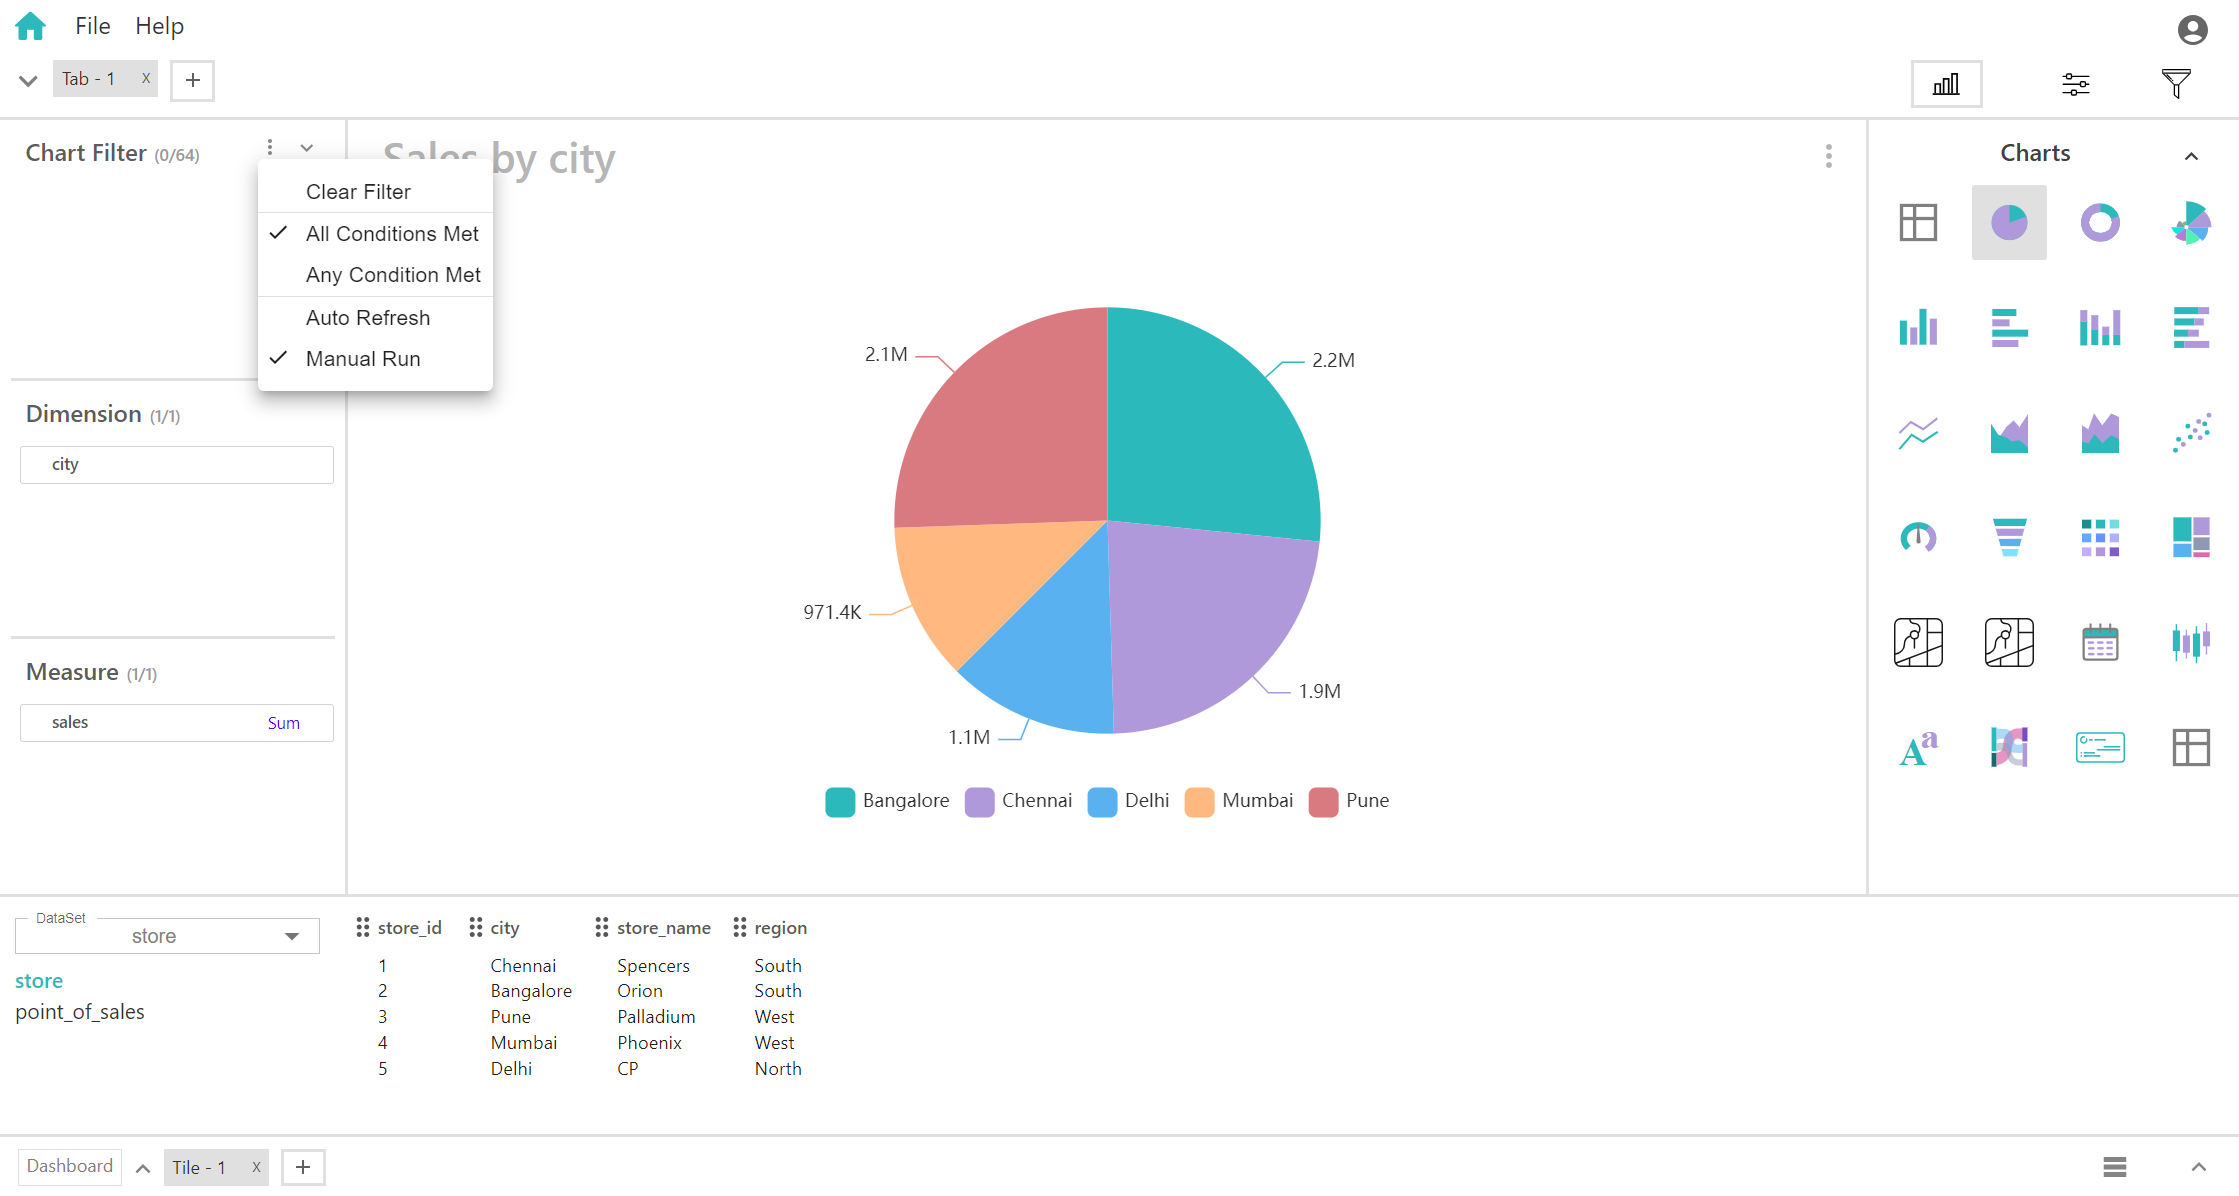
There are 25+ visualization types available in Silzila and each chart is elaborately covered in this section. The coverage include: list of charts, how many fields required to create charts, settings to customize the charts including legends, labels, tooltips, axis, etc.,

Filters are important aspect of modern visualization, helps in interactively explore and analyze the data to uncover meaningful insights. Discussed in this section are: filter types, chart level filter, filtering group and override filters.

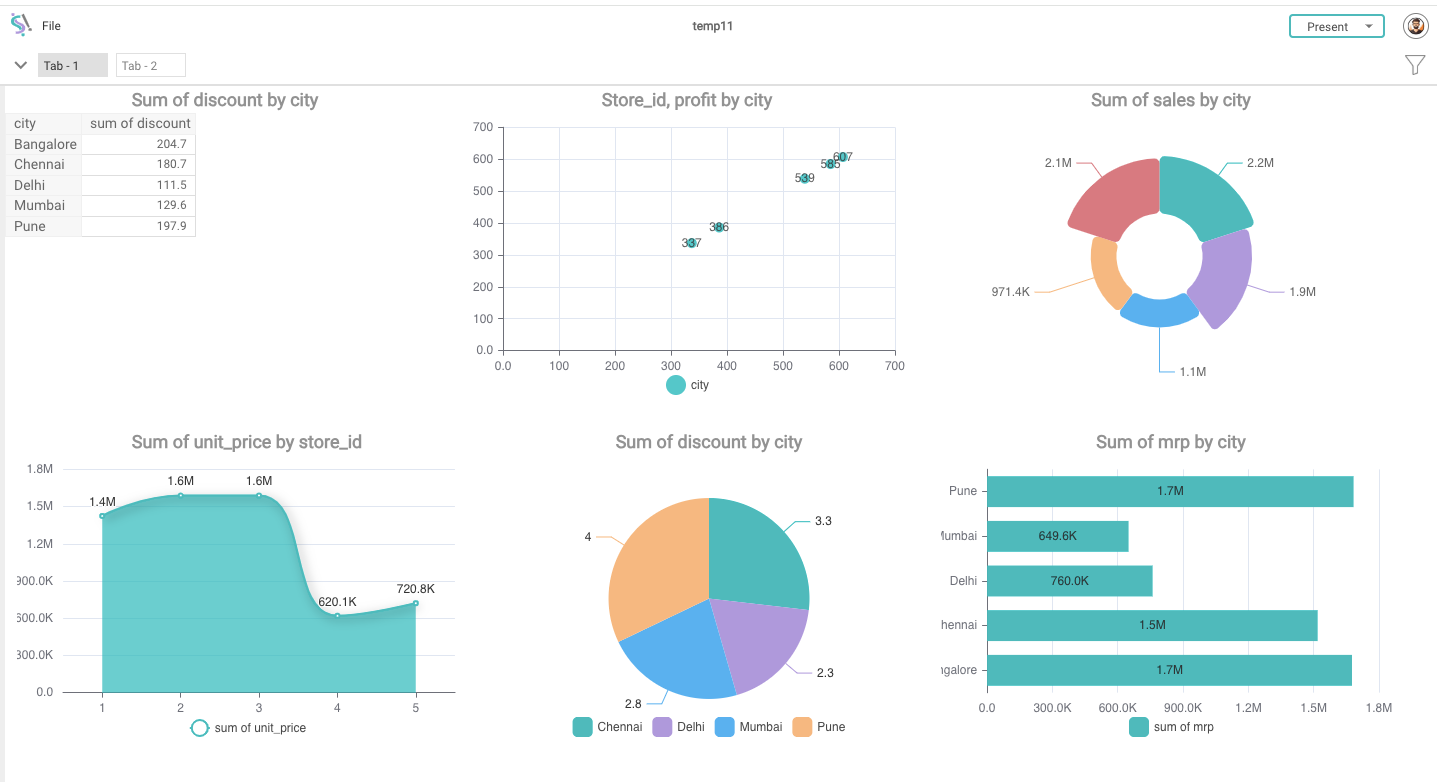
Playbook is a workbook containing one or more dashboards. Each dashboard may contain one or more visuals with or without filter groups. Playbooks are the ultimate way to share insights/findings to others (within organization or to the entire world). Sections covered in this section are: how to create playbook out of charts, adding filters, applying filters to selective charts, changing aspect ratio of playbook and how to save playbook.


