 Signin


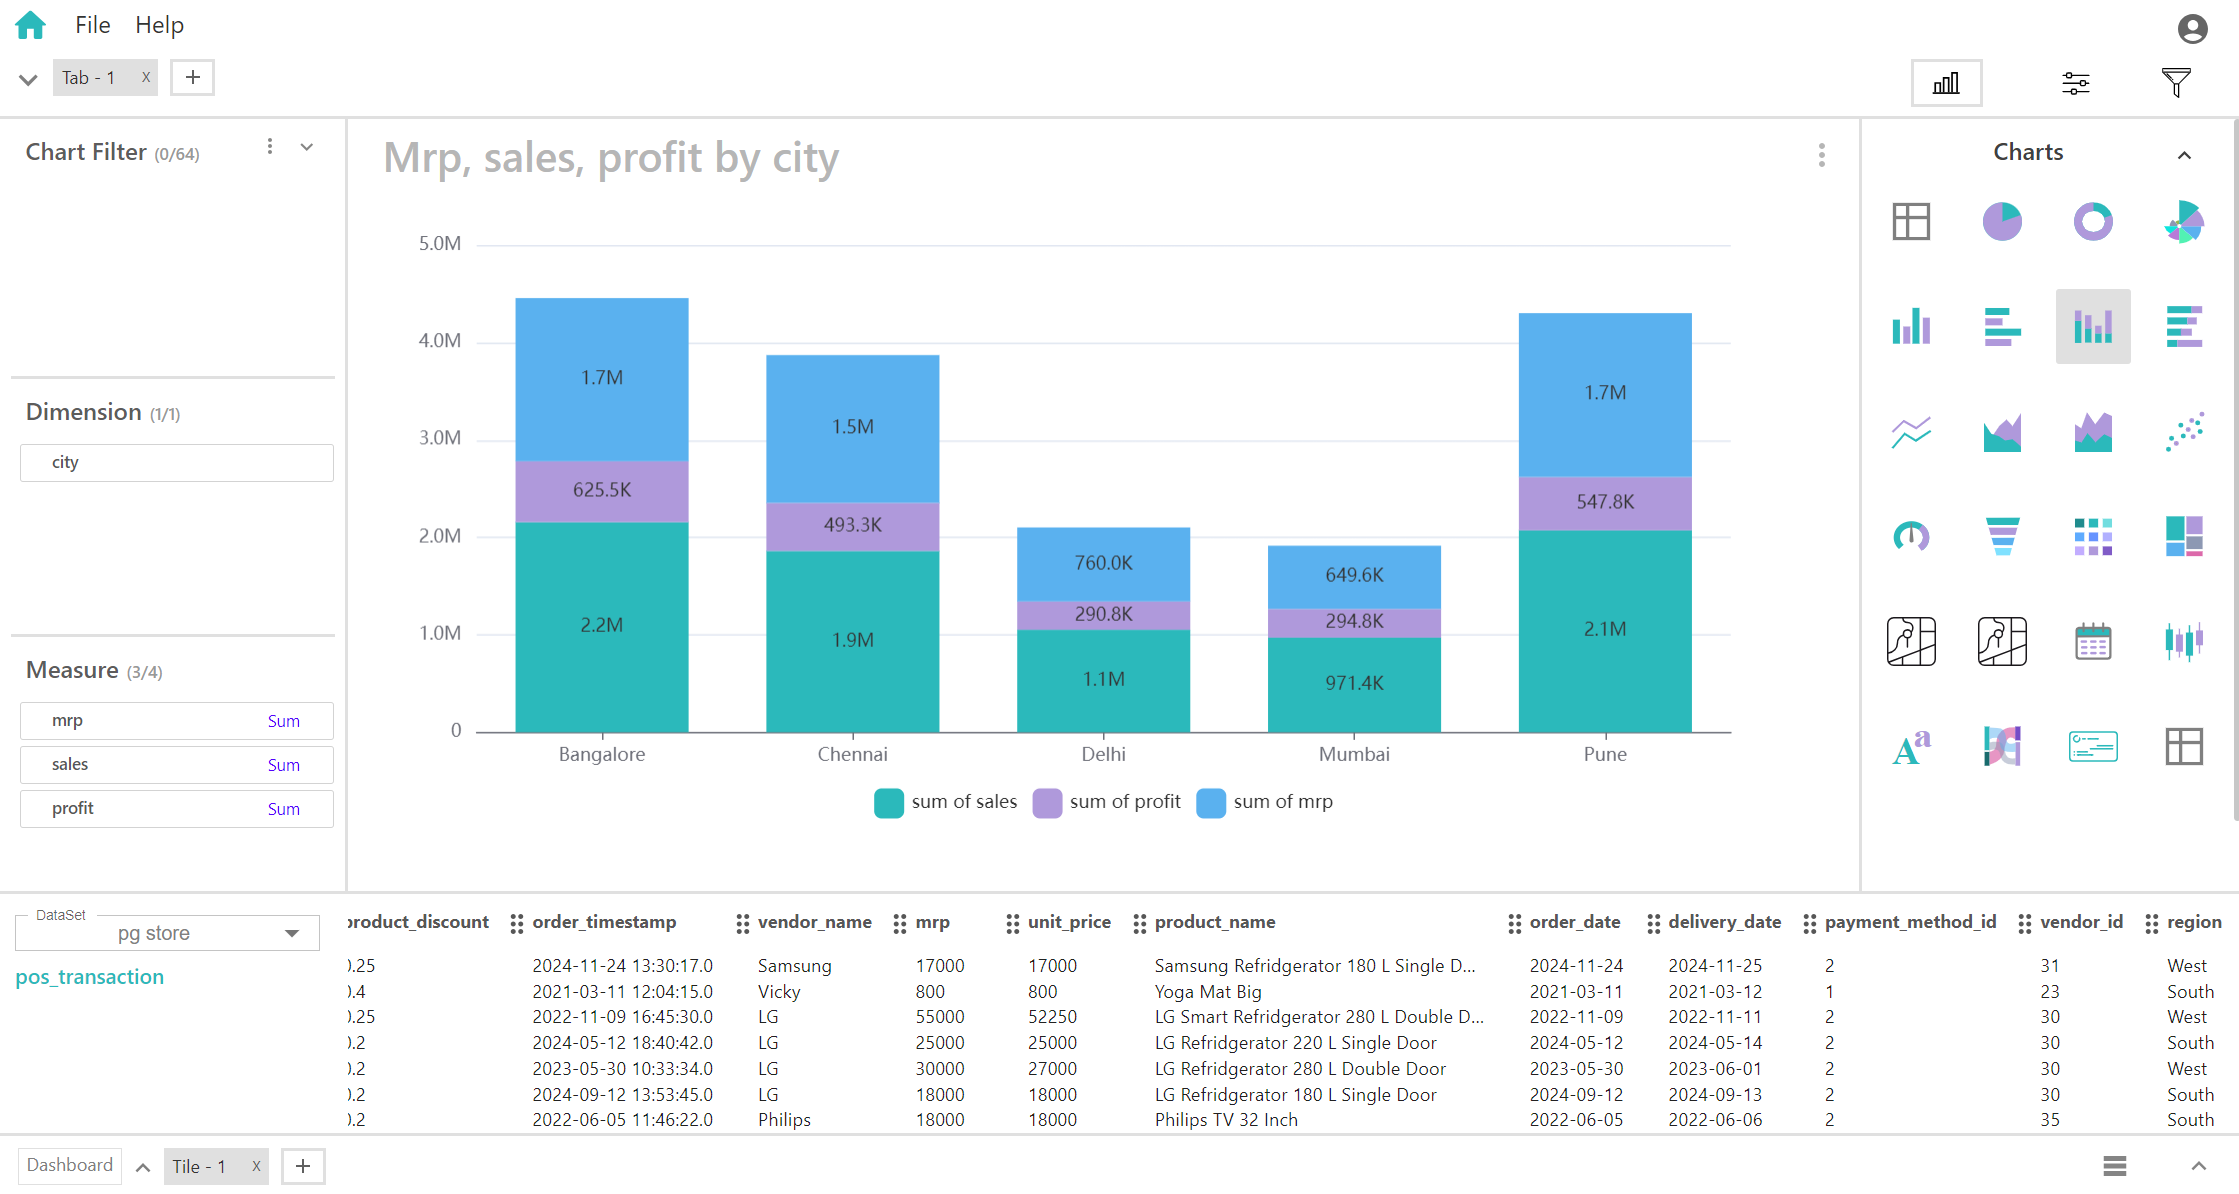
Stacked Bar Chart
A stacked bar chart is a type of bar chart where bars are divided into segments representing different subcategories or measures. When using a stacked bar chart with one dimension and four measures, the chart is designed to show the cumulative total of multiple measures for each category, with each measure contributing a portion to the total bar length.
Key Fields of a Stacked Bar Chart
- The single categorical variable that segments the data along the horizontal axis. This dimension defines the categories for which the measures are displayed.
- Categories such as different time periods, cities, regions, or product types.
- Multiple numerical values associated with each category. Each measure represents a different aspect or metric, and they are stacked together to show the cumulative total for each category.
- Different performance metrics like sales revenue, profit, expenses, etc.
You can display a maximum of One Dimension and Four measures in your chart/table.
When to Use a Stacked Bar Chart:
- Use a stacked bar chart to understand how each of the four measures contributes to the total value within each category. This helps in analyzing the composition of each bar and identifying the proportion of each measure.
- Ideal for comparing both the total values and the distribution of the four measures across different categories. It allows for a clear view of how each measure contributes to the overall total for each category and how these contributions vary between categories.
- Effective for observing how the contribution of each of the four measures changes over time or across different categories if the dimension represents different time periods or groups. This can help in identifying trends and shifts in the data.