 Signin


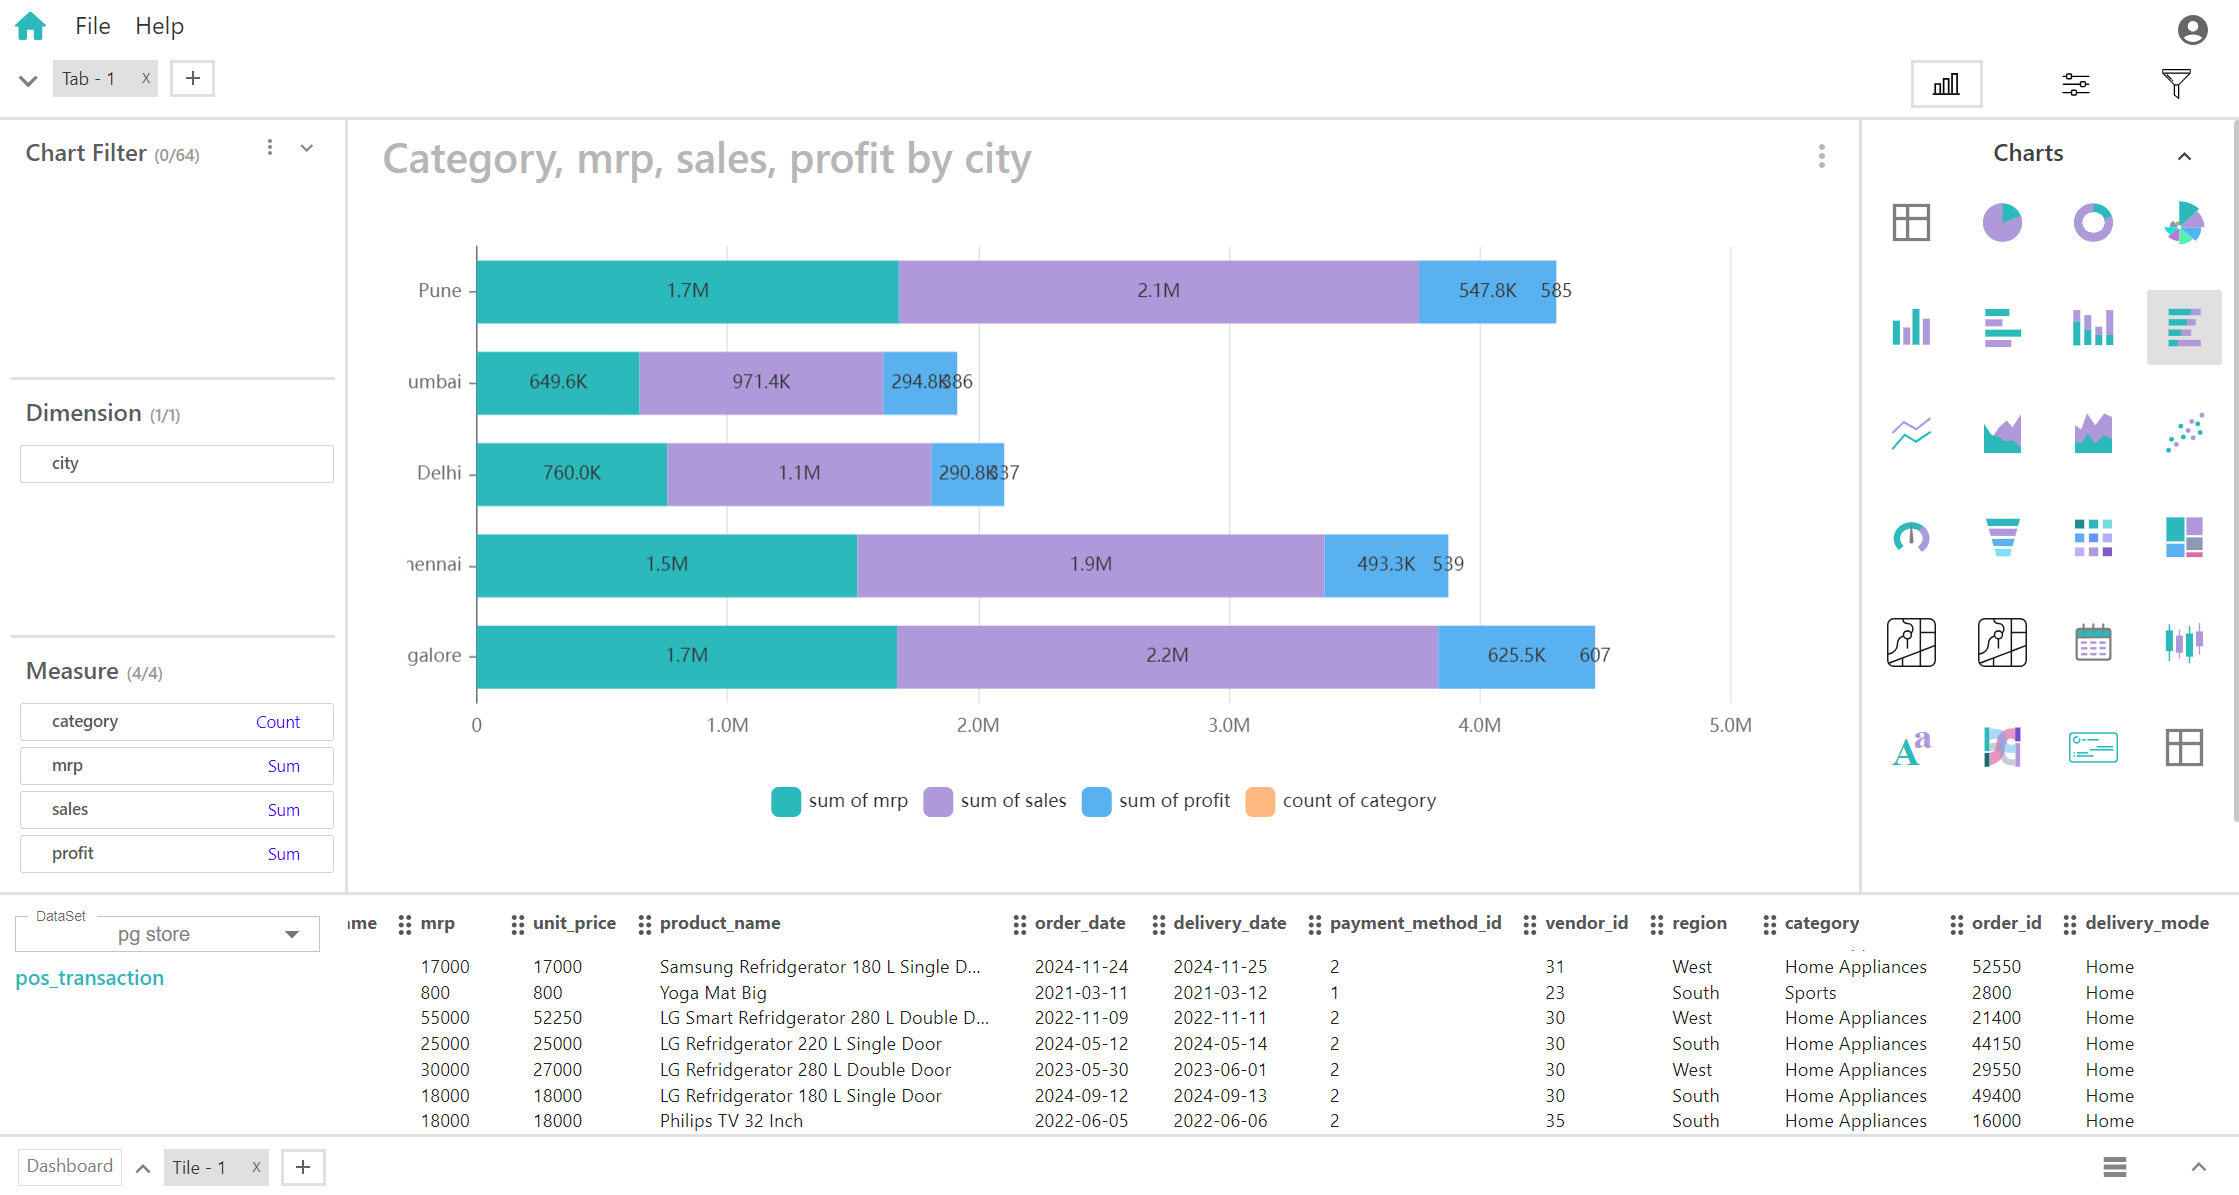
Horizontal Stacked Bar Chart
A horizontal stacked bar chart is used to display and compare the composition of multiple measures within a single dimension, with the bars oriented horizontally. When you have one dimension and four measures, each horizontal bar represents a category from the dimension, and the bar is divided into segments corresponding to the four measures.
Key Fields of a Horizontal Stacked Bar Chart
- The single categorical variable that defines the groups on the vertical axis. Each category is represented by a horizontal bar.
- Categories such as different cities, regions, products, or time periods.
- The numerical values that are represented as segments within each bar. Each of the four measures is shown as a segment stacked on top of the other to illustrate its contribution to the total value for each category.
- Various metrics like sales revenue, profit, expenses, and discounts.
You can display a maximum of One Dimension and Four measures in your chart/table.
When to Use a Horizontal Stacked Bar Chart:
- Ideal for cases where category labels are long and could be cumbersome if placed on a vertical axis. The horizontal layout provides ample space for longer labels, enhancing readability.
- Useful for comparing total values and their detailed breakdowns into four measures across different categories. This format allows you to see how each measure contributes to the overall total within each category and facilitates comparison between categories.
- Provides a clear view of how the four measures are distributed within each category. The horizontal orientation helps in understanding the composition of each bar, making it easier to interpret the proportions of each measure relative to the total value.