 Signin


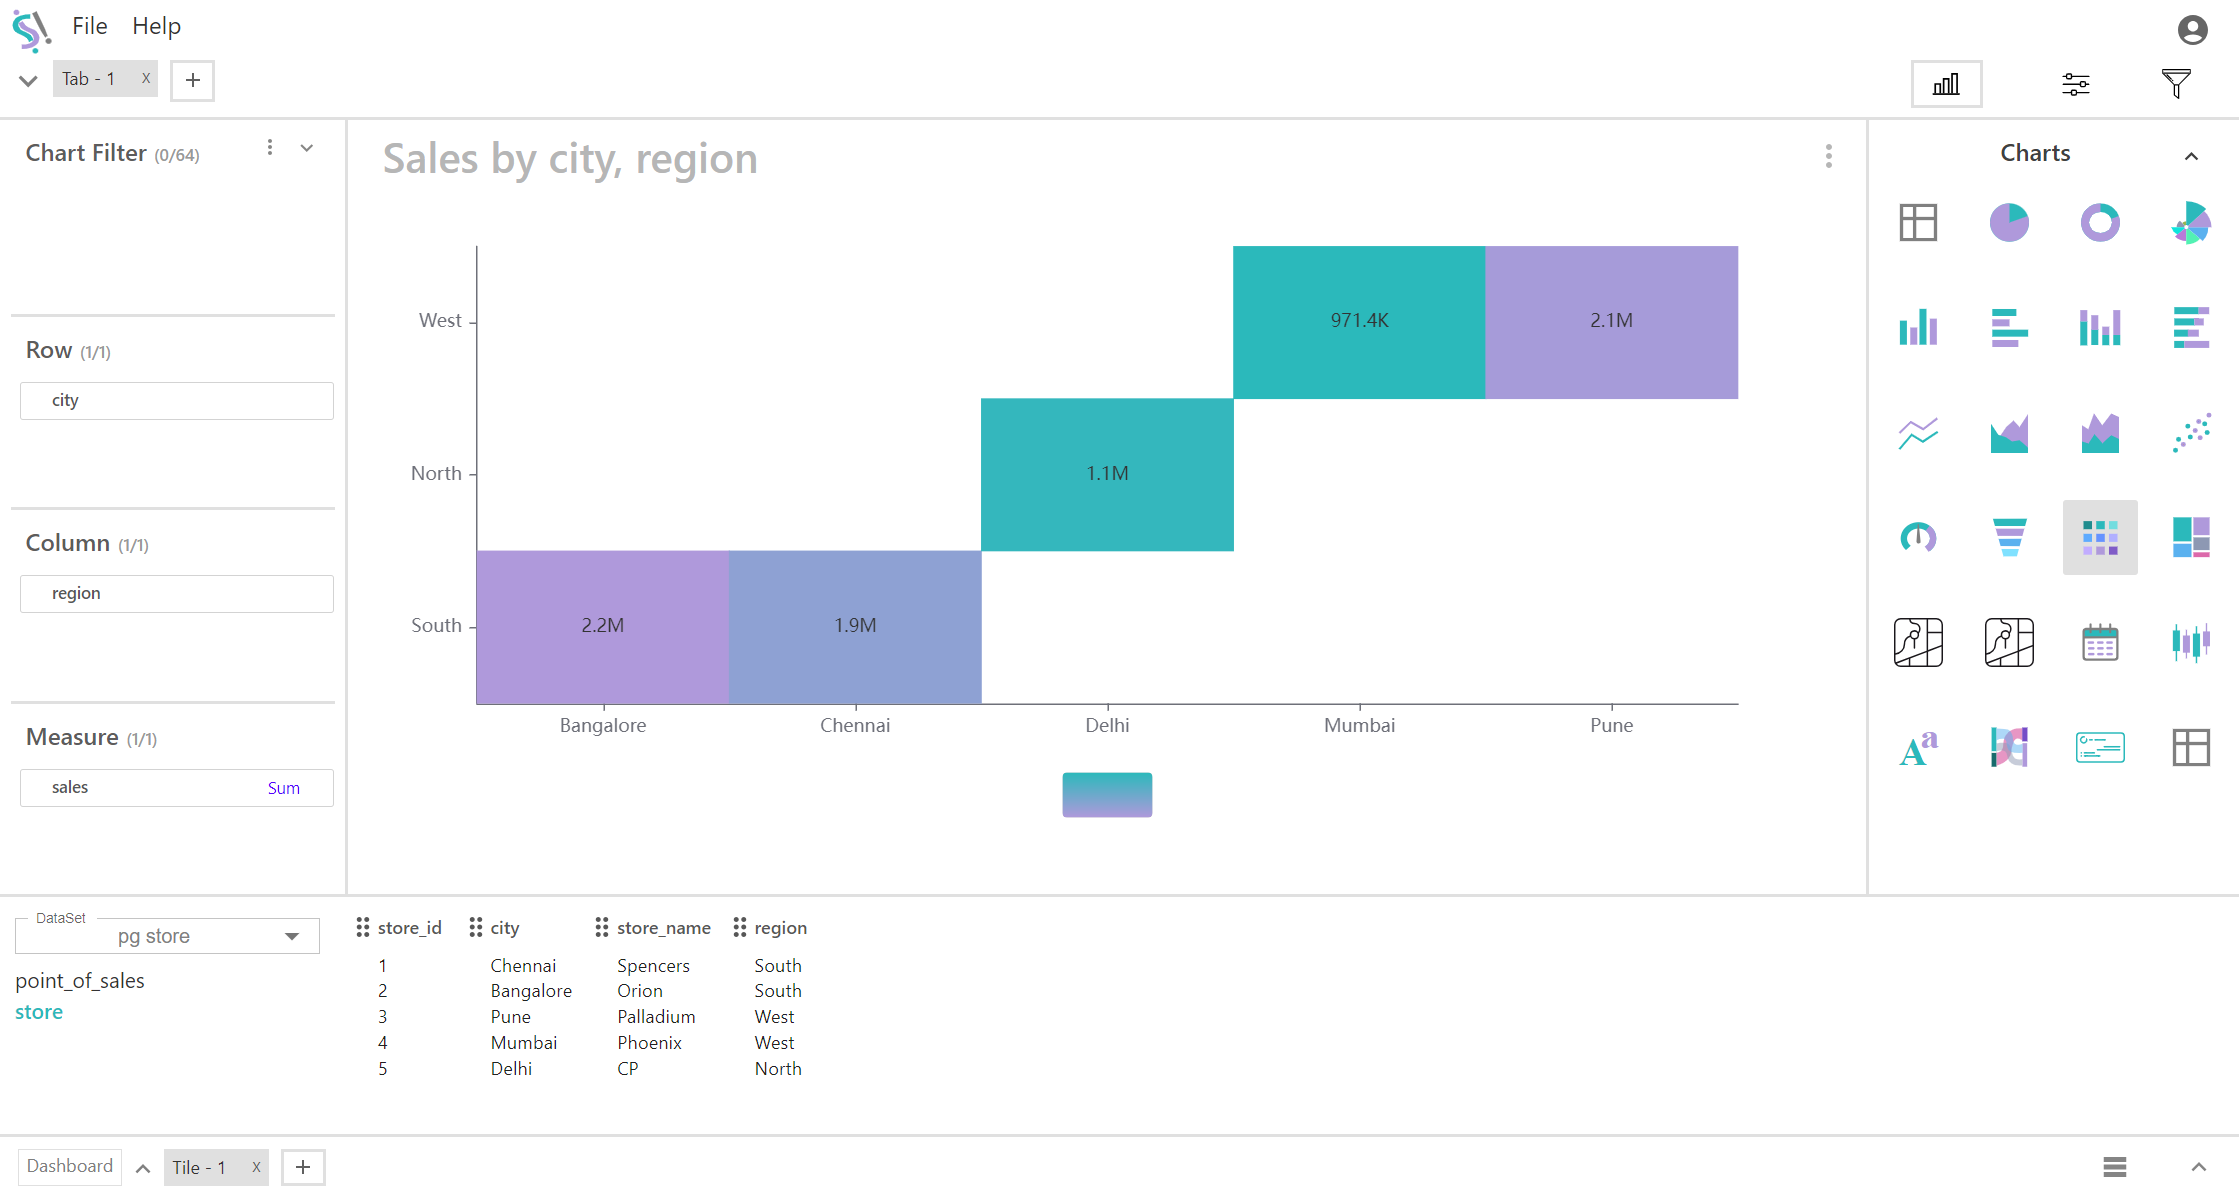
Heat Map
A heat map is a data visualization tool used to represent data values in a matrix format, where the intensity of color indicates the magnitude of the values. In a simplified heat map with one row, one column, and one measure, the focus is on a single data point within a matrix, which provides a visual representation of that specific value’s intensity.
Key Fields of a Heat Map
- Represents the category or dimension in which the data is being analyzed. In this simplified heat map, there is only one row. Positioned horizontally across the heat map. Defines the context or category for the single measure displayed. Even though there is only one row, it serves to categorize the data point within that row.
- A single row could represent a City, region, specific time period, or a single category.
- Represents the other dimension or aspect of the data. In this case, there is only one column. Positioned vertically in the heat map. Provides the context or category for the measure in that column. It complements the row to identify the specific data point.
- A single column could represent a specific metric, such as "Sales Revenue."
- Represents the quantitative value associated with the single data point in the heat map. Displayed in the intersection of the single row and column. The value is visually represented using color intensity, where different colors or shades indicate different levels of magnitude or performance.
- Measure Value: Sum of Sales
- Color Intensity: Darker shades could represent higher values, while lighter shades indicate lower values.
You can display a maximum of One Row, One Column and One Measure in your chart/table.
When to Use a Heat Map:
- Useful for visualizing a single data point within a matrix. This can be useful in cases where you want to highlight or analyze a specific value without the complexity of a full matrix.
- Ideal for quickly showing the intensity or magnitude of a single metric in a specific category or time period.
- Helpful for quick comparison of a single data point against benchmarks or targets, especially when you are focusing on one dimension and one measure.