 Signin


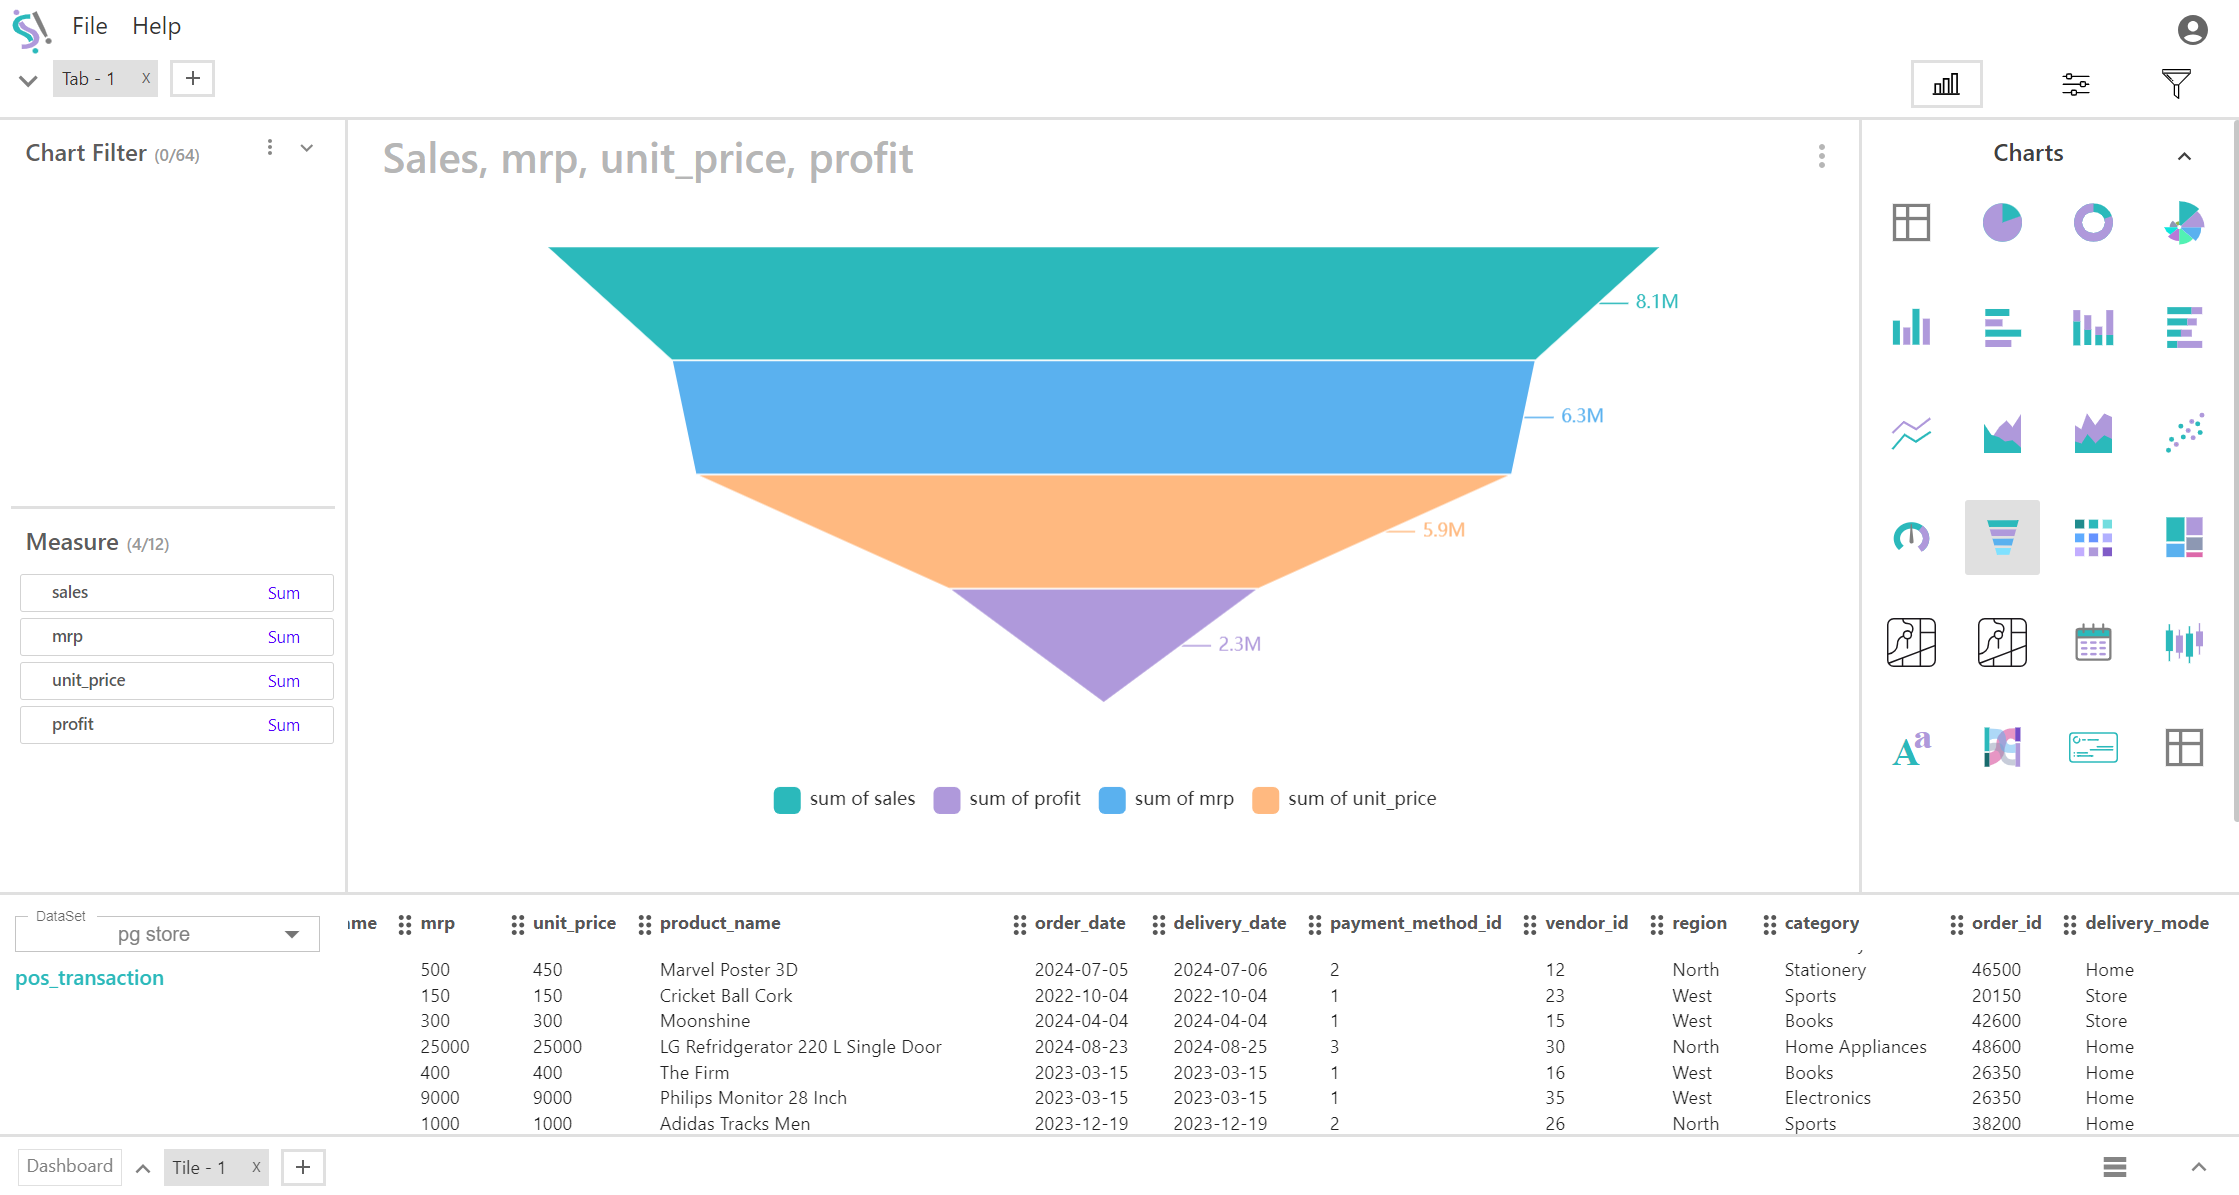
Funnel Chart
A funnel chart is a type of data visualization used to represent the stages in a process and show how data progresses from one stage to the next. It is particularly useful for illustrating the flow of data through various stages and identifying potential bottlenecks or drop-offs.
Key Field of a Funnel Chart
Measure:
The measure is a numerical value that indicates the amount or count at each stage of the funnel. Each stage in the funnel is represented by a different measure, showing how the quantity of interest decreases as it progresses through various stages.
- Measures for a sales funnel might include: Sum of Sales, Sum of profit, Lead Generation, Initial Contact, Qualification, Proposal Sent, Negotiation, Contract Sent, Contract Signed, First Purchase, Repeat Purchase, Upsell Opportunity, Product Feedback, and Customer Retention.
You can display a maximum of 12 Stage measures in your chart/table.
When to Use a Funnel Chart:
- Ideal for visualizing stages in a process and identifying where the largest drop-offs occur. Useful for sales pipelines, customer journeys, or any multi-stage process.
- Helps in tracking performance metrics at each stage, making it easier to pinpoint stages where improvements are needed.
- Effective for showing conversion rates from one stage to the next and understanding the overall efficiency of a process.