 Signin


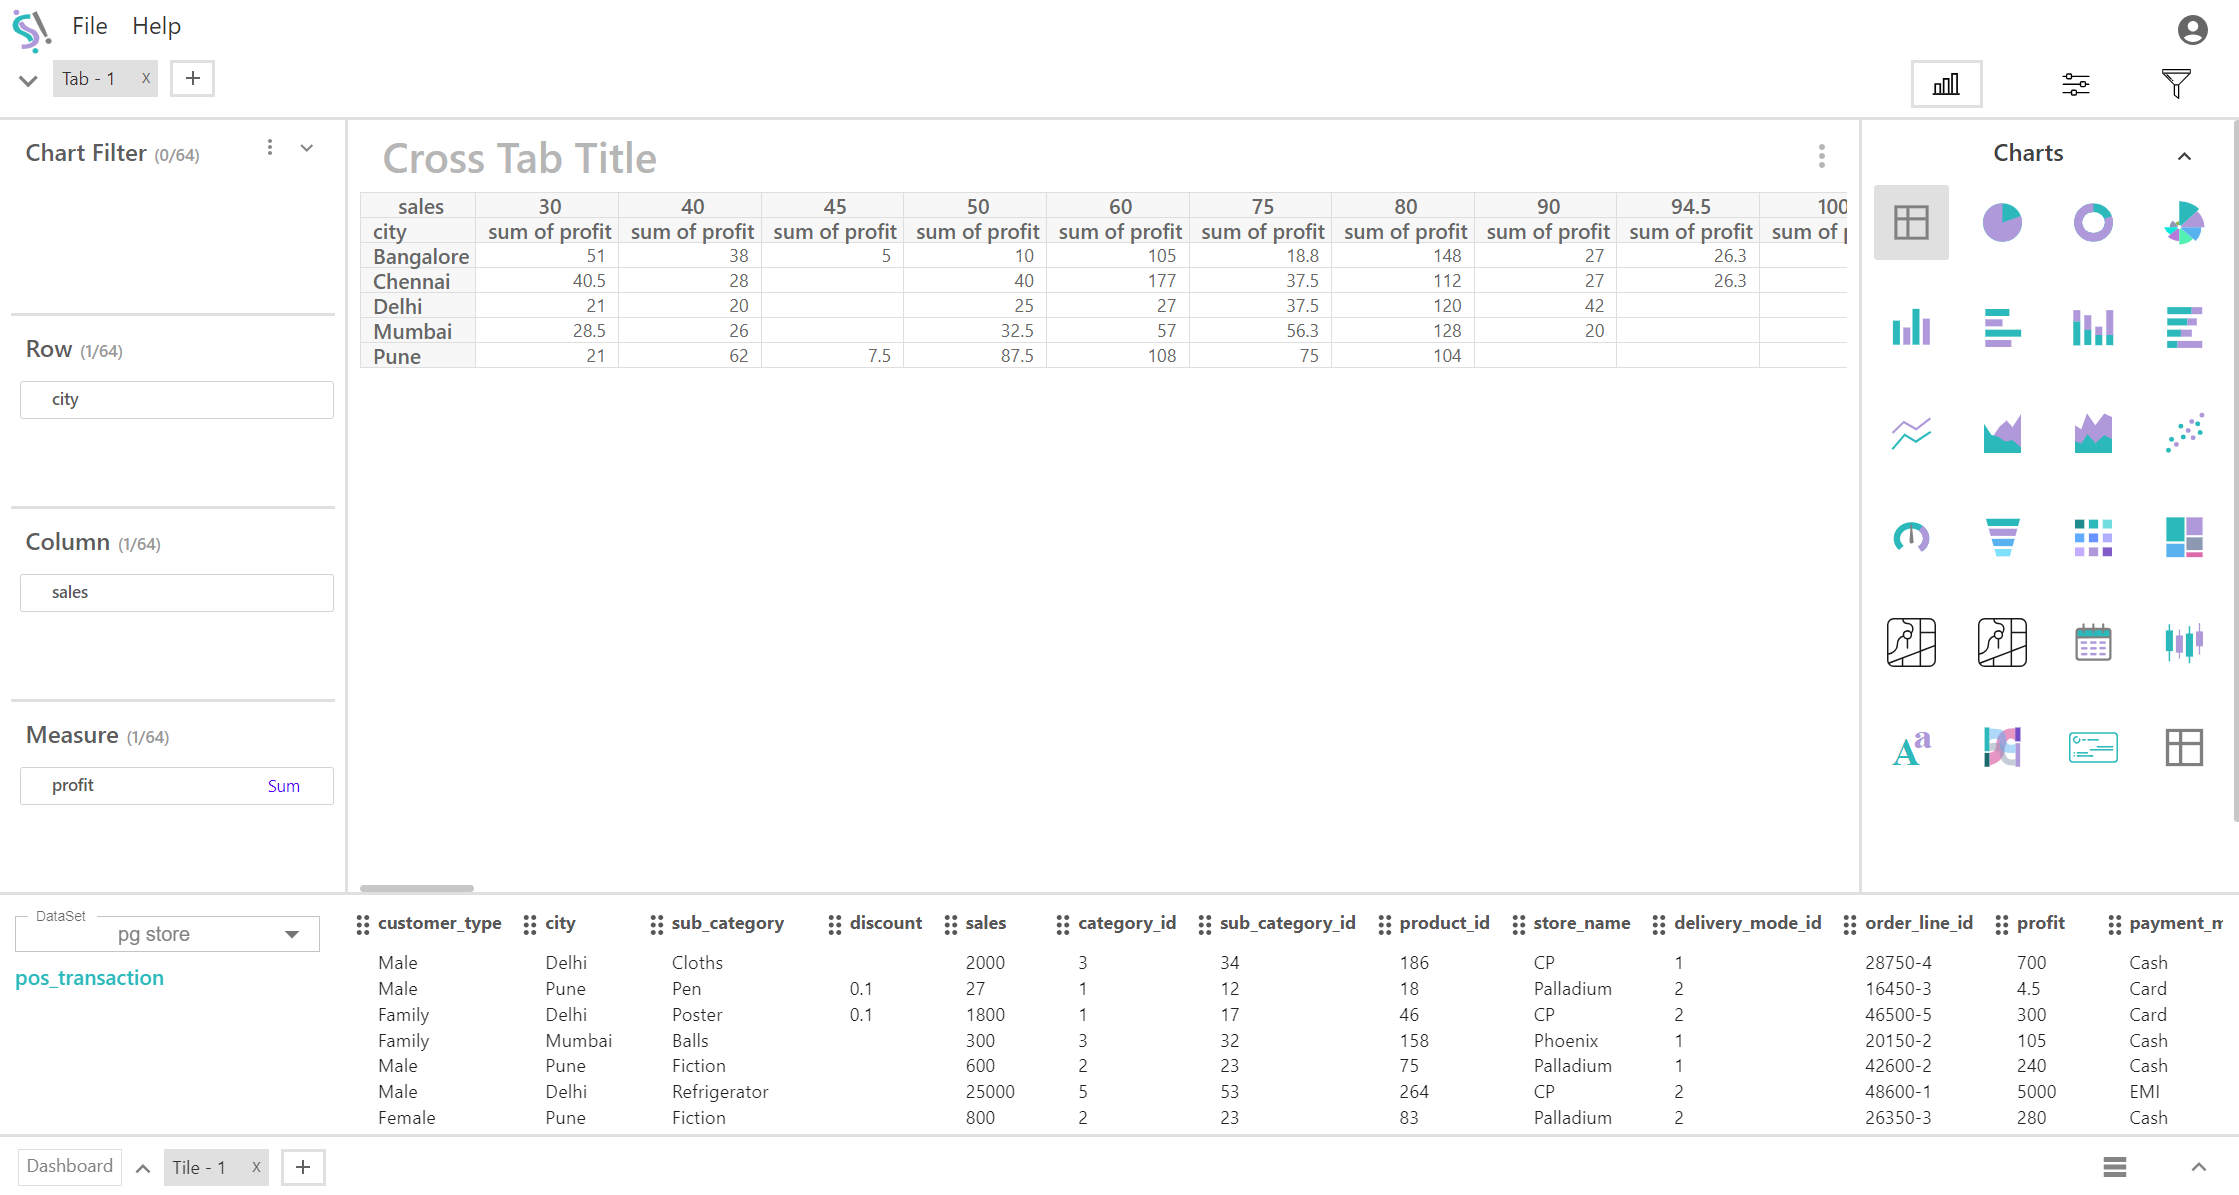
Cross Tab
A Cross tab is used to analyze and explore the relationship between two or more categorical variables. It is commonly presented in table format where the rows represent categories of one or more variables, and the columns represent categories of another variable. The intersection of these rows and columns shows the sum, count, or other occurrences for each combination of categories.
Key fields of Cross tab:
- Represents the categories or values of one or more variables.
- Represents the categories or values of another variable.
- Provides the numerical data for each combination of row and column categories, such as counts, sum, average, etc.
You can display a maximum of 64 rows, 64 columns, and 64 measures in your chart/table.